
Monitoring is an essential part of any modern infrastructure. It helps you keep an eye on system performance, detect anomalies, and identify potential issues before they become critical. With the right tools, monitoring can be a straightforward process that provides valuable insights into your system's health.
However, if you're like me, you can feel that setting up an effective monitoring system today can be daunting, especially for those who are new to the field. There are a plethora of tools and technologies available, and it can be difficult to know where to start.
In this article, I will show you how to set up Promtail, Telegraf, InfluxDB, Loki, and Grafana to monitor your system's performance and logs plus Kuma for service availability and alerts. I've selected this toolchain because is reasonably straightforward to setup, shows good potential and flexibility for further growing needs.
And I've created this docker-compose setup TLIG v1.0.2 so you can have a reference to use as a starter.
By the end of this article, you will have a good understanding of how to set up a monitoring system for your infrastructure, and an idea on how you'll be able to customize it to meet some of your specific needs.

What to Monitor
With a system's design approach, we can identify the critical components of your infrastructure and then set up monitoring for those components so you have the right monitoring at the right levels. Any component in your service tech stack that is sensible to computing resources should be monitored for performance.
Some times a component could go down and the service would still be able to operate in a degraded state. Sometimes it won't be able to and you need to receive an adequate alarm pointing to that.
Let's review their categories:
Infrastructure. Components can include servers, network devices, and storage systems. It's essential to monitor the health and performance of these components to detect issues that may lead to downtime or data loss. Kuma is going to help with this.
Application Services. These are the backbone of any system. Monitoring the performance of the backend service is essential to ensure that requests are being processed efficiently and without errors. Telegraf will help here by efficiently collecting periodic measures as instructed in its customizable configuration and plugins. The availability status is going to be covered by Kuma and its performance will be displayed in Grafana dashboards.
Application Logs. Logs are the most obvious and expected way for headless services to leave a human readable trace of their activity for any system. They provide valuable information about what's happening in your application and have big value to be used to diagnose issues, identify trends, and even track user behavior. Loki will be used to have this accessible in one place and easy to query.
Metrics. Metrics provide a high-level view of system performance over time. They help to identify trends and potential issues before they become critical. Metrics can include CPU usage, memory usage, disk space, network traffic and the usage of many other resources. Again, all of the performance details are going to be displayed in Grafana dashboards.
Let's take a moment to review each component and its function:
Promtail
Promtail is a log collector and parser that sends logs to Loki. It can tail log files, filter logs based on patterns, and enrich log data with metadata. Promtail is designed to be highly scalable and can handle a large number of log streams.
Telegraf
Telegraf is a plugin-driven server agent that can collect and send metrics to a variety of datastores. It supports a wide range of input plugins, including system metrics, network metrics, and Docker stats. Telegraf can also transform and aggregate metrics before sending them to the datastore.
InfluxDB
InfluxDB is a time-series database that stores and queries time-stamped data. It provides a SQL-like query language for querying and aggregating data. InfluxDB is highly scalable and can handle millions of writes per second.
Loki
Loki is a horizontally scalable, highly available log aggregation system. It is designed to be a cost-effective way to handle large amounts of log data. Loki can ingest logs from various sources, including Promtail, and allows you to search and filter logs based on labels.
Grafana
Grafana is a popular open-source platform for data visualization and monitoring. It can connect to various data sources, including InfluxDB and Loki, and provides an appealing web-based interface for creating and sharing dashboards. Grafana supports a wide range of visualization options, including charts, tables, and alerts.
Now that we have a good understanding of each component's role in the monitoring stack, let's move on to setting up the monitoring system using Docker Compose as found in TLIG v1.0.2.
docker-compose.yml
version: "3"

networks:
  tlig:

services:
  loki:
    image: grafana/loki:2.4.0
    init: true
    env_file:
      - .env
    volumes:
      - ./conf/loki:/etc/loki:rw
    ports:
      - ${DOCKER_LOKI_PORT}:3100
    restart: unless-stopped
    command: -config.file=/etc/loki/loki-config.yml
    depends_on:
      - promtail
    networks:
      - tlig
  promtail:
    image: grafana/promtail:2.4.0
    init: true
    env_file:
      - .env
    volumes:
      - /var/log:/var/log:ro
      - ./conf/promtail:/etc/promtail:rw
    restart: unless-stopped
    command: -config.file=/etc/promtail/promtail-config.yml
    networks:
      - tlig
  influxdb:
    image: influxdb:2.1.1
    init: true
    volumes:
      - ./data/influxdb:/var/lib/influxdb2:rw
    env_file:
      - .env
    entrypoint: ["./entrypoint.sh"]
    restart: on-failure:10
    ports:
      - ${DOCKER_INFLUXDB_INIT_PORT}:8086
    networks:
      - tlig
  telegraf:
    image: telegraf:1.19
    init: true
    volumes:
      - ${TELEGRAF_CFG_PATH}:/etc/telegraf/telegraf.conf:ro
    env_file:
      - .env
    depends_on:
      - influxdb
    restart: unless-stopped
    networks:
      - tlig
  grafana:
    image: grafana/grafana-oss:8.4.3
    init: true
    user: ${USER_ID}
    volumes:
      - ./data/grafana:/var/lib/grafana:rw
    env_file:
      - .env
    depends_on:
      - telegraf
      - loki
    restart: unless-stopped
    ports:
      - ${GRAFANA_PORT}:3000
    networks:
      - tlig
  kuma:
    image: louislam/uptime-kuma:1
    init: true
    container_name: kuma
    env_file:
      - .env
    volumes:
      - ./data/kuma:/app/data:rw
    ports:
      - ${KUMA_PORT}:3001
    restart: unless-stopped
    security_opt:
      - no-new-privileges:true
Create a .env for yourself based in this .env.sample:
DOCKER_INFLUXDB_INIT_MODE=setup

## Environment variables used during the setup and operation of the stack
#

# Primary InfluxDB admin/superuser credentials
#
DOCKER_INFLUXDB_INIT_USERNAME=admin

# Make sure this pwd is not too short so Influx doesn't reject it.
DOCKER_INFLUXDB_INIT_PASSWORD=adminpwd1234

# Generate your own with `openssl rand -hex 32`
DOCKER_INFLUXDB_INIT_ADMIN_TOKEN=blahblahblahrandomstringtoken

# Primary InfluxDB organization & bucket definitions
#
DOCKER_INFLUXDB_INIT_ORG=yourorganization
DOCKER_INFLUXDB_INIT_BUCKET=telegraf

# Primary InfluxDB bucket retention period
#
# NOTE: Valid units are nanoseconds (ns), microseconds(us), milliseconds (ms)
# seconds (s), minutes (m), hours (h), days (d), and weeks (w).
DOCKER_INFLUXDB_INIT_RETENTION=4d

# InfluxDB port & hostname definitions
#
DOCKER_INFLUXDB_INIT_PORT=8086
DOCKER_INFLUXDB_INIT_HOST=influxdb

# Telegraf configuration file
#
# Will be mounted to container and used as telegraf configuration
TELEGRAF_CFG_PATH=./conf/telegraf/telegraf.conf

# Loki port definition
#
#
DOCKER_LOKI_PORT=3100
DOCKER_LOKI_GRPC_PORT=9096

# Promtail port definition
#
#
DOCKER_PROMTAIL_PORT=9080
DOCKER_PROMTAIL_GRPC_PORT=0

# Grafana port definition
# Grafana default uses 3000 but let's move that elsewere, since that's
# a popular port for many developing setups.
GRAFANA_PORT=3008
USER_ID=xxxx #replace xxxx with what you have for `$(id -u)`

# Kuma port definition
KUMA_PORT=3009
For running it in one host, you should be good by setting the username, password, token, organization name and bucket name for InfluxDB and all the ports and USER_ID.
You'll be able to further config Promtail, Loki and Telegraf editing the files in ./conf/. For example, you'll see that promtail-config.yml has a commented docker job for collecting all container logs in Loki which is quite neat.
With that ready, you can start it with:
docker-compose up -d --force-recreateGrafana first time login
Open Grafana GUI by navigating to http://localhost:3008 and, since it's the first time, you can login using admin / admin and later change to proper credentials.
Go to Add your first data source and add Loki from the list.
Use these http://loki:3100 for the URL field (or the port number value you had in your .env for it).
Press the Save & test button.
Back to Grafana's home, add another data source and this time add InfluxDB from the list.
Use these values:
Query language: Flux.
URL: http://influxdb:8086.
Basic auth: off.
Organization: use what you have set for DOCKER_INFLUXDB_INIT_ORG in your .env file.
Press the Save & test button.
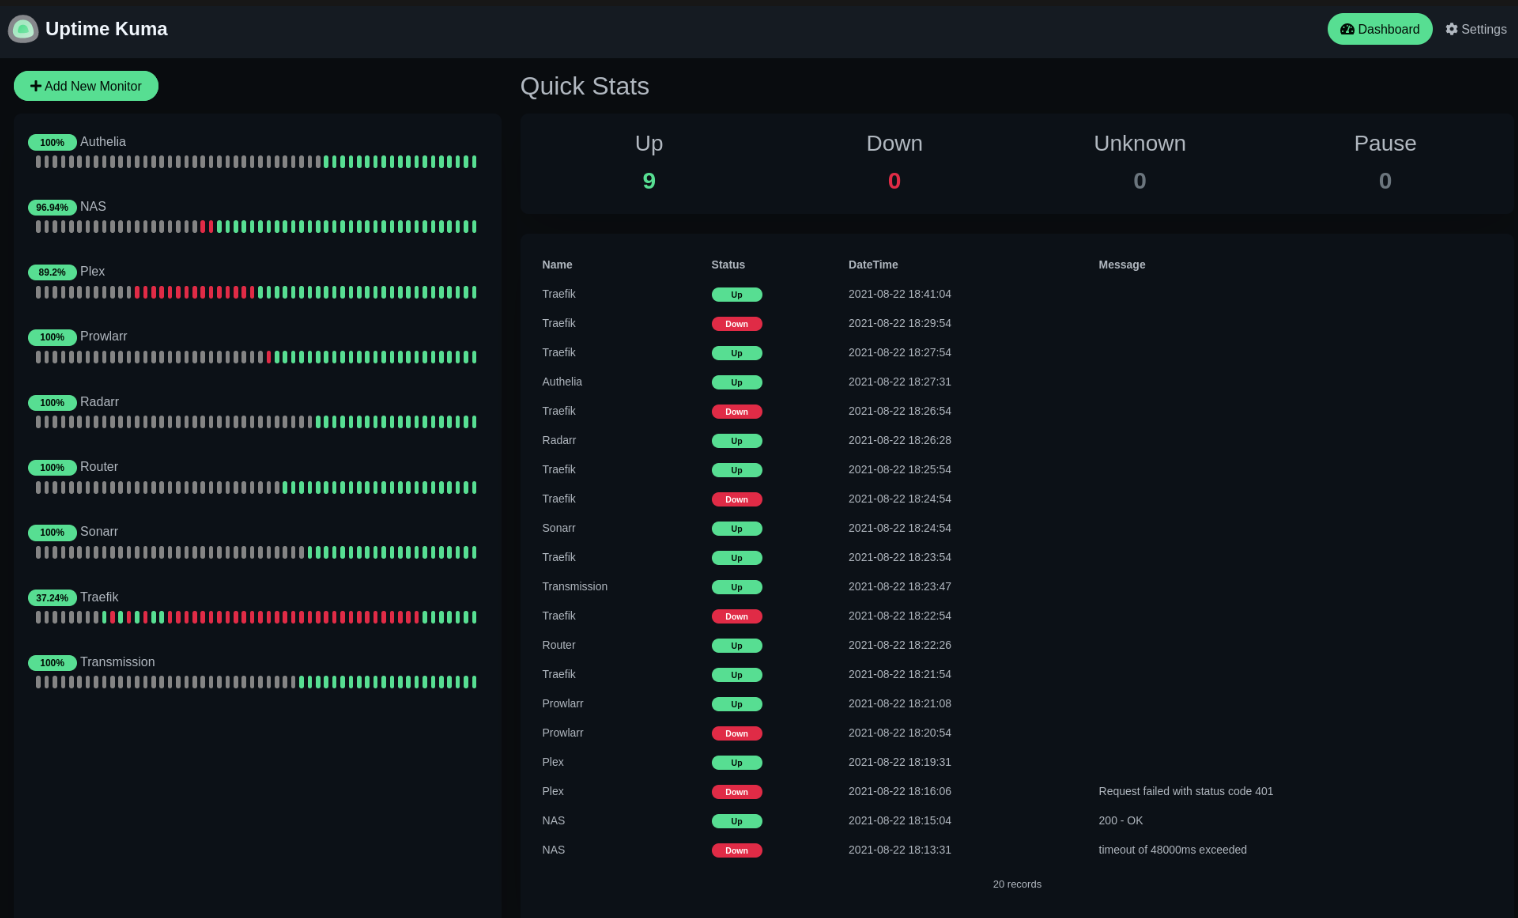
Kuma
If you navigate to http://localhost:3009 you'll have Kuma ready to add new monitors that will be very easy to setup to your health-check endpoints.
NGINX
For deploying all this in your servers, all the services can be proxied in a simple way as you would expect, except Grafana and Kuma that will need a bit of attention for its WebSockets needs. Here is how you Configure NGINX for Grafana and here how to have Kuma as Reverse Proxy.
In conclusion, setting up an effective monitoring system for your infrastructure is an essential task that can help you identify potential issues before they become critical, detect anomalies, and keep an eye on system performance. While there are many tools and technologies available, Promtail, Telegraf, InfluxDB, Loki, Grafana, and Kuma are an excellent combination to get started with. And with the TLIG v1.0.2 docker-compose file, hopefully you have some help to start doing it.
Remember that monitoring is an ongoing process that requires continuous improvement and adjustment. As your infrastructure grows, your monitoring system should also evolve to meet new challenges and requirements. With the right tools and strategies, you can ensure the health and reliability of your systems, and proactively address any issues that may arise.
I can easily see how this article might need a follow up to monitor a service managed with Kubernetes and running microservices developed with Pharo Smalltalk, of course 😊